Quantcast
Channel: Mathematical Modeling – Robert Kaplinsky
Viewing all 18 articles
Browse latest View live

High School Common Core Modeling Standards

$
0
0

The Common Core State Standards (CCSS) emphasizes mathematical modeling, or “link[ing] classroom mathematics and statistics to everyday life, work, and decision-making” for all grade levels with Math Practice 4.  Some content standards are easier than others to connect to everyday life, and often the more abstract the standard is, the more challenging it is to make these connections.

The High School Modeling standards are integrated into the content standards as opposed to listed separately in their own cluster.  Most a star symbol next to each standard to designate that this content standard is more easily modeled.  Specifically they mention:

Modeling is best interpreted not as a collection of isolated topics but rather in relation to other standards. Making mathematical models is a Standard for Mathematical Practice, and specific modeling standards appear throughout the high school standards indicated by a star symbol (★).

Additionally, if all the standards in a domain (such as High School: Number and Quantity: Quantities) are modeling standards, then only the domain will have an asterisk (not a star) by the name.  The individual standards will not have a star.  Furthermore, in the case of High School: Statistics & Probability, every single standard in the domain is a modeling standard and there are no stars anywhere.

It should also be emphasized that these are not the only standards that can be mathematically modeled in high school.  They are just the standards the CCSS authors specifically want integrated with their role in everyday life.

I have gone through all of the High School content standards and compiled a complete list of all modeling standards including the ones that only apply to California.  This is a great place to start if you are a High School teacher who is looking to connect math to the real world but don’t know where to begin.  You can download a PDF version of this list by clicking on the blue “Download PDF version” button below.


Number and Quantity

  • N-Q.1 – Use units as a way to understand problems and to guide the solution of multi-step problems; choose and interpret units consistently in formulas; choose and interpret the scale and the origin in graphs and data displays.
  • N-Q.2 – Define appropriate quantities for the purpose of descriptive modeling.
  • N-Q.3 – Choose a level of accuracy appropriate to limitations on measurement when reporting quantities.


Algebra

  • A-SSE.1 – Interpret expressions that represent a quantity in terms of its context.
    • A-SSE.1a – Interpret parts of an expression, such as terms, factors, and coefficients.
    • A-SSE.1 b – Interpret complicated expressions by viewing one or more of their parts as a single entity. For example, interpret P(1+r)n as the product of P and a factor not depending on P.
  • A-SSE.3 Choose and produce an equivalent form of an expression to reveal and explain properties of the quantity represented by the expression.
    • A-SSE.3a – Factor a quadratic expression to reveal the zeros of the function it defines.
    • A-SSE.3b – Complete the square in a quadratic expression to reveal the maximum or minimum value of the function it defines.
    • A-SSE.3c – Use the properties of exponents to transform expressions for exponential functions. For example the expression 1.15t can be rewritten as (1.151/12)12t ≈ 1.01212t to reveal the approximate equivalent monthly interest rate if the annual rate is 15%.
  • A-SSE.4 – Derive the formula for the sum of a finite geometric series (when the common ratio is not 1), and use the formula to solve problems. For example, calculate mortgage payments.
  • A-CED.1 – Create equations and inequalities in one variable and use them to solve problems. Include equations arising from linear and quadratic functions, and simple rational and exponential functions.
  • A-CED.2 – Create equations in two or more variables to represent relationships between quantities; graph equations on coordinate axes with labels and scales.
  • A-CED.3 – Represent constraints by equations or inequalities, and by systems of equations and/or inequalities, and interpret solutions as viable or nonviable options in a modeling context. For example, represent inequalities describing nutritional and cost constraints on combinations of different foods.
  • A-CED.4 – Rearrange formulas to highlight a quantity of interest, using the same reasoning as in solving equations. For example, rearrange Ohm’s law V = IR to highlight resistance R.
  • A-REI.11 – Explain why the x-coordinates of the points where the graphs of the equations y = f(x) and y = g(x) intersect are the solutions of the equation f(x) = g(x); find the solutions approximately, e.g., using technology to graph the functions, make tables of values, or find successive approximations. Include cases where f(x) and/or g(x) are linear, polynomial, rational, absolute value, exponential, and logarithmic functions.


Functions

  • F-IF.4 – For a function that models a relationship between two quantities, interpret key features of graphs and tables in terms of the quantities, and sketch graphs showing key features given a verbal description of the relationship. Key features include: intercepts; intervals where the function is increasing, decreasing, positive, or negative; relative maximums and minimums; symmetries; end behavior; and periodicity.
  • F-IF.5 – Relate the domain of a function to its graph and, where applicable, to the quantitative relationship it describes. For example, if the function h(n) gives the number of person-hours it takes to assemble n engines in a factory, then the positive integers would be an appropriate domain for the function.
  • F-IF.6 – Calculate and interpret the average rate of change of a function (presented symbolically or as a table) over a specified interval. Estimate the rate of change from a graph.
  • F-IF.7 – Graph functions expressed symbolically and show key features of the graph, by hand in simple cases and using technology for more complicated cases.
    • F-IF.7a – Graph linear and quadratic functions and show intercepts, maxima, and minima.
    • F-IF.7b – Graph square root, cube root, and piecewise-defined functions, including step functions and absolute value functions.
    • F-IF.7c – Graph polynomial functions, identifying zeros when suitable factorizations are available, and showing end behavior.
    • F-IF.7d – Graph rational functions, identifying zeros and asymptotes when suitable factorizations are available, and showing end behavior.
    • F-IF.7e – Graph exponential and logarithmic functions, showing intercepts and end behavior, and trigonometric functions, showing period, midline, and amplitude.
  • F-BF.1 – Write a function that describes a relationship between two quantities.
    • F-BF.1a – Determine an explicit expression, a recursive process, or steps for calculation from a context.
    • F-BF.1b – Combine standard function types using arithmetic operations. For example, build a function that models the temperature of a cooling body by adding a constant function to a decaying exponential, and relate these functions to the model.
    • F-BF.1c – Compose functions. For example, if T(y) is the temperature in the atmosphere as a function of height, and h(t) is the height of a weather balloon as a function of time, then T(h(t)) is the temperature at the location of the weather balloon as a function of time.
  • F-BF.2 – Write arithmetic and geometric sequences both recursively and with an explicit formula, use them to model situations, and translate between the two forms.
  • F-LE.1 – Distinguish between situations that can be modeled with linear functions and with exponential functions.
    • F-LE.1a – Prove that linear functions grow by equal differences over equal intervals, and that exponential functions grow by equal factors over equal intervals.
    • F-LE.1b – Recognize situations in which one quantity changes at a constant rate per unit interval relative to another.
    • F-LE.1c – Recognize situations in which a quantity grows or decays by a constant percent rate per unit interval relative to another.
  • F-LE.2 – Construct linear and exponential functions, including arithmetic and geometric sequences, given a graph, a description of a relationship, or two input-output pairs (include reading these from a table).
  • F-LE.3 – Observe using graphs and tables that a quantity increasing exponentially eventually exceeds a quantity increasing linearly, quadratically, or (more generally) as a polynomial function.
  • F-LE.4 – For exponential models, express as a logarithm the solution to abct = d where a, c, and d are numbers and the base b is 2, 10, or e; evaluate the logarithm using technology.
    • (California only) F-LE.4.1 – Prove simple laws of logarithms.
    • (California only) F-LE.4.2 – Use the definition of logarithms to translate between logarithms in any base.
    • (California only) F-LE.4.3 – Understand and use the properties of logarithms to simplify logarithmic numeric expressions and to identify their approximate values.
  • F-LE.5 – Interpret the parameters in a linear or exponential function in terms of a context.
  • (California only) F-LE.6 – Apply quadratic functions to physical problems, such as the motion of an object under the force of gravity.
  • F-TF.5 – Choose trigonometric functions to model periodic phenomena with specified amplitude, frequency, and midline.
  • F-TF.7 – Use inverse functions to solve trigonometric equations that arise in modeling contexts; evaluate the solutions using technology, and interpret them in terms of the context.


Geometry

  • G-SRT.8 – Use trigonometric ratios and the Pythagorean Theorem to solve right triangles in applied problems.
  • G-GPE.7 – Use coordinates to compute perimeters of polygons and areas of triangles and rectangles, e.g., using the distance formula.
  • G-GMD.3 – Use volume formulas for cylinders, pyramids, cones, and spheres to solve problems.
  • G-MG.1 – Use geometric shapes, their measures, and their properties to describe objects (e.g., modeling a tree trunk or a human torso as a cylinder).
  • G-MG.2 – Apply concepts of density based on area and volume in modeling situations (e.g., persons per square mile, BTUs per cubic foot).
  • G-MG.3 – Apply geometric methods to solve design problems (e.g., designing an object or structure to satisfy physical constraints or minimize cost; working with typographic grid systems based on ratios).


Statistics and Probability

  • S-ID.1 – Represent data with plots on the real number line (dot plots, histograms, and box plots).
  • S-ID.2 – Use statistics appropriate to the shape of the data distribution to compare center (median, mean) and spread (interquartile range, standard deviation) of two or more different data sets.
  • S-ID.3 – Interpret differences in shape, center, and spread in the context of the data sets, accounting for possible effects of extreme data points (outliers).
  • S-ID.4 – Use the mean and standard deviation of a data set to fit it to a normal distribution and to estimate population percentages. Recognize that there are data sets for which such a procedure is not appropriate. Use calculators, spreadsheets, and tables to estimate areas under the normal curve.
  • S-ID.5 – Summarize categorical data for two categories in two-way frequency tables. Interpret relative frequencies in the context of the data (including joint, marginal, and conditional relative frequencies). Recognize possible associations and trends in the data.
  • S-ID.6 – Represent data on two quantitative variables on a scatter plot, and describe how the variables are related.
    • S-ID.6a – Fit a function to the data; use functions fitted to data to solve problems in the context of the data. Use given functions or choose a function suggested by the context. Emphasize linear, quadratic, and exponential models.
    • S-ID.6b – Informally assess the fit of a function by plotting and analyzing residuals.
    • S-ID.6c – Fit a linear function for a scatter plot that suggests a linear association.
  • S-ID.7 – Interpret the slope (rate of change) and the intercept (constant term) of a linear model in the context of the data.
  • S-ID.8 – Compute (using technology) and interpret the correlation coefficient of a linear fit.
  • S-ID.9 – Distinguish between correlation and causation.
  • S-IC.1 – Understand statistics as a process for making inferences about population parameters based on a random sample from that population.
  • S-IC.2 – Decide if a specified model is consistent with results from a given data-generating process, e.g., using simulation. For example, a model says a spinning coin falls heads up with probability 0.5. Would a result of 5 tails in a row cause you to question the model?
  • S-IC.3 – Recognize the purposes of and differences among sample surveys, experiments, and observational studies; explain how randomization relates to each.
  • S-IC.4 – Use data from a sample survey to estimate a population mean or proportion; develop a margin of error through the use of simulation models for random sampling.
  • S-IC.5 – Use data from a randomized experiment to compare two treatments; use simulations to decide if differences between parameters are significant.
  • S-IC.6 – Evaluate reports based on data.
  • S-CP.1 – Describe events as subsets of a sample space (the set of outcomes) using characteristics (or categories) of the outcomes, or as unions, intersections, or complements of other events (“or,” “and,” “not”).
  • S-CP.2 – Understand that two events A and B are independent if the probability of A and B occurring together is the product of their probabilities, and use this characterization to determine if they are independent.
  • S-CP.3 – Understand the conditional probability of A given B as P(A and B)/P(B), and interpret independence of A and B as saying that the conditional probability of A given B is the same as the probability of A, and the conditional probability of B given A is the same as the probability of B.
  • S-CP.4 – Construct and interpret two-way frequency tables of data when two categories are associated with each object being classified. Use the two-way table as a sample space to decide if events are independent and to approximate conditional probabilities. For example, collect data from a random sample of students in your school on their favorite subject among math, science, and English. Estimate the probability that a randomly selected student from your school will favor science given that the student is in tenth grade. Do the same for other subjects and compare the results.
  • S-CP.5 – Recognize and explain the concepts of conditional probability and independence in everyday language and everyday situations. For example, compare the chance of having lung cancer if you are a smoker with the chance of being a smoker if you have lung cancer.
  • S-CP.6 – Find the conditional probability of A given B as the fraction of B’s outcomes that also belong to A, and interpret the answer in terms of the model.
  • S-CP.7 – Apply the Addition Rule, P(A or B) = P(A) + P(B) – P(A and B), and interpret the answer in terms of the model.
  • S-CP.8 – Apply the general Multiplication Rule in a uniform probability model, P(A and B) = P(A)P(B|A) = P(B)P(A|B), and interpret the answer in terms of the model.
  • S-CP.9 – Use permutations and combinations to compute probabilities of compound events and solve problems.
  • S-MD.1 – Define a random variable for a quantity of interest by assigning a numerical value to each event in a sample space; graph the corresponding probability distribution using the same graphical displays as for data distributions.
  • S-MD.2 – Calculate the expected value of a random variable; interpret it as the mean of the probability distribution.
  • S-MD.3 – Develop a probability distribution for a random variable defined for a sample space in which theoretical probabilities can be calculated; find the expected value. For example, find the theoretical probability distribution for the number of correct answers obtained by guessing on all five questions of a multiple-choice test where each question has four choices, and find the expected grade under various grading schemes.
  • S-MD.4 – Develop a probability distribution for a random variable defined for a sample space in which probabilities are assigned empirically; find the expected value. For example, find a current data distribution on the number of TV sets per household in the United States, and calculate the expected number of sets per household. How many TV sets would you expect to find in 100 randomly selected households?
  • S-MD.5 – Weigh the possible outcomes of a decision by assigning probabilities to payoff values and finding expected values.
  • S-MD.5a – Find the expected payoff for a game of chance. For example, find the expected winnings from a state lottery ticket or a game at a fast-food restaurant.
  • S-MD.5b – Evaluate and compare strategies on the basis of expected values. For example, compare a high-deductible versus a low-deductible automobile insurance policy using various, but reasonable, chances of having a minor or a major accident.
  • S-MD.6- Use probabilities to make fair decisions (e.g., drawing by lots, using a random number generator).
  • S-MD.7 – Analyze decisions and strategies using probability concepts (e.g., product testing, medical testing, pulling a hockey goalie at the end of a game).
 

Download PDF version


What Isn’t Mathematical Modeling?

$
0
0

Many teachers reading the Standards for Mathematical Practice are confused by what “Model with Mathematics” (Math Practice 4) means.  I define mathematical modeling as the process of taking an often real-world context, turning it into something you can manipulate with mathematics, and then returning to the context with the new knowledge.  For example if you want to figure out how many stars there are in the universe, mathematical modeling involves creating a representation, or mathematical model, for approximating the number of stars.  This is often the hardest part of the process, as once you have your model you can figure out the answer.  However, without the model, there are no numbers to calculate.

Fortunately, the first draft of the California Mathematics Framework Chapters is out and the chapter on mathematical modeling has a very helpful section called “What isn’t mathematical modeling?”  Here is the section in its entirety:

The terms “model” and “modeling” have several connotations, and while the term “model” has a general definition of “using one thing to represent something else,” mathematical modeling is something more specific. Below is a list of some things that are not mathematical modeling in the sense of the CCSSM.
  • It is not modeling in the sense of, “I do; now you do.”
  • It is not modeling in the sense of using manipulatives to represent mathematical concepts (these might be called “using concrete representations” instead.)
  • It is not modeling in the sense of a “model” being just a graph, equation, or function.  Modeling is a process.
  • It is not just starting with a real world situation and solving a math problem; it is returning to the real world situation and using the mathematics to inform our understanding of the world. (I.e. contextualizing and de-contextualizing, see MP.2.)
  • It is not beginning with the mathematics and then moving to the real world; it is starting with the real world (concrete) and representing it with mathematics.

It has been my experience that teachers who read “Model with mathematics” for the first time most often think it means the second and third bullets.  Students may use manipulatives or make representations during the process of modeling a situation but they are not themselves the models.

Many teachers think that they are providing opportunities for students to model with mathematical when in fact they are doing either the fourth or fifth bullets.  The fifth bullet would be a situation where a teacher instructs student on a concept and then has students apply it to a real world problem.  While this may be better than nothing, providing students with the real world context first gives students an opportunity to build necessary critical thinking skills as well as develop a desire to learn the skills they need to tackle the problem.

Personally, I would add a sixth bullet: “It is not beginning with a contrived real world situation; it is starting with a situation that is as close to how students would actually encounter it as possible.”  For example, consider these two area problems:

  1. “You are making a garden that is 60 square feet.  What dimensions can the garden be?”
  2. “You are making a garden and have a budget of $100.  What dimensions can the garden be?”

Some people say that problem #1 is an example of mathematical modeling.  To me, it is not a strong case as it is rare that someone knows the final area of their garden first and then can choose the dimensions.  I think problem #2 can eventually lead to problem 1, but it begins with a more realistic context.

What other mathematical modeling misconceptions would you add to this list?

Going For A Carnival Ride

$
0
0

About two months ago I had the opportunity to work with a class of struggling 8th graders in a support class.  I chose to do the ticket option lesson with them and wanted to share my experiences and some student work samples.  From my previous experiences working with these students, I knew they struggled mathematically but were somewhat willing to persevere if they were interested in the context.  The teacher also informed me that they had already covered unit rates in her class this year (though I know it was also covered in 6th and 7th grade as well).

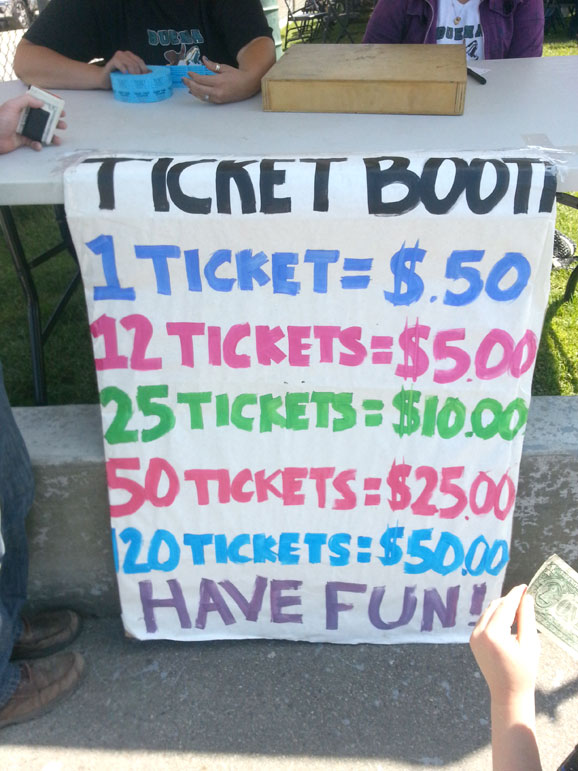
I began by passing out the Problem Solving Framework (which I am continuously refining) and the ticket booth picture.  I explained how I took the picture below when I went to a carnival and wasn’t sure which tickets I should buy.

I then asked students the first three challenges at the same time (at this point I was still asking students the questions rather than having students come up with their own questions):

  • Which ticket option is the best deal?
  • Which ticket option is the worst deal?
  • Which ticket options are the same deal?

This is where I encountered my first unexpected challenge.  Students didn’t understand what “best” meant in this context.  I assumed that everyone thought “best” meant the lowest cost per ticket.  However to these students “best” meant “most tickets” and many students immediately wrote down that $50 for 120 tickets was the “best” deal without doing any additional work.  I asked them why and they said that it was the deal that would give them the most tickets.

I decided to play dumb and present two ideas of “best” I was trying to figure out.  Was 120 tickets for $50 the “best” deal because I got the most tickets or was 1 ticket for $.50 the “best” deal because I spent the least amount of money.  A conversation ensued with students eventually concluding that both the quantity of tickets and the cost of the tickets mattered.  They did not talk about combining them together in terms of a rate at this point.

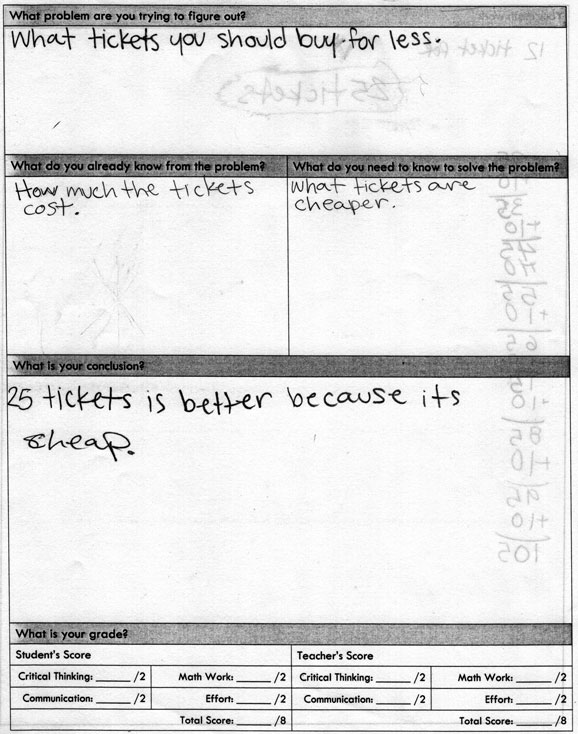
I next asked them to fill out their Problem Solving Framework and explain “What problem are you trying to figure out?”  Many students still stated that they wanted to know which deal would give them the most tickets.  We did a think-pair-share to discuss what everyone had written.  Eventually we discussed (again) what “best” meant.  I will admit that I wasn’t loving that we had spent almost 15 minutes on just what the question was asking.  The positive side was that I was able to bring this issue to light.  This was something that was hindering their critical thinking and it could have sabotaged the lesson for some students if it wasn’t addressed.

From there I asked them to describe “What do you already know from the problem?” and “What do you need to know to solve the problem?”  For the information that they already know, most students either rewrote the ticket price chart or stated that they knew the ticket prices.  However, when I asked students to tell me about the information they need to know, they said:

  • How many tickets will we use?
  • How long will we be staying there?
  • How many people are we going with?
  • How many tickets do the rides cost?

Questions like these are actually quite common with real-world problem-based lessons.  Clearly students were having trouble abstracting the context to simply explore the price per ticket.  In real life we would be unlikely to use 120 tickets so we would not even consider that as an option.  They had trouble letting go of this reality.   I didn’t want to tell them that these questions were irrelevant so instead I told them that we will be staying there all day, that rides cost many tickets, and that we came with bunch of people.  I made it clear to them that no matter how many tickets we buy, we will use them.  We just want to find the “best” deal.  It is worth wondering whether students would be able to get past this if this was a constructed response question on a CCSS assessment?  Would they answer, “I don’t know until I know how long we will be staying at the carnival.”

With that completed, I set them free to try out the problem.  Unfortunately students were still unsure of how to proceed.  They could not come up with any strategy to analyze the data and struggled for about ten minutes.  Most did not realize that they could buy the same ticket option repeatedly (for example, 2 sets of 25 tickets for $10 is better than 1 set of 50 tickets for $25).  I was trying my best to, as Dan Meyer says, “be less helpful.”  Clearly I could just tell them all to divide the price by the number of tickets to get the unit rate.  If I did that it might even appear like they understood what to do .  However it is also a great way to sweep their misunderstandings under the rug and not address them.

I decided to have a discussion about what would happen if you bought one ticket twice, then one ticket three times, then all the way until ten times.  Light bulbs started turning on in their brains and they realized that buying the 12 tickets for $5 was a better option than 10 tickets for $5 if bought one at a time.  However the downside of this discussion was that it skewed their thinking process into only comparing similar rates for the rest of the period.  Not a single student attempted a unit rate strategy.  With more time or a second day, I would have guided them towards this strategy.  However the period was almost over so we had a discussion about what we had found so far and I collected their Problem Solving Frameworks.

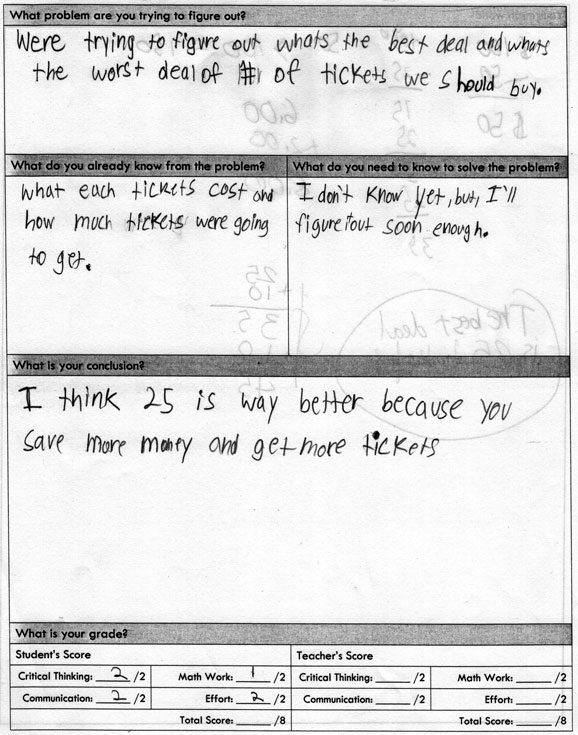
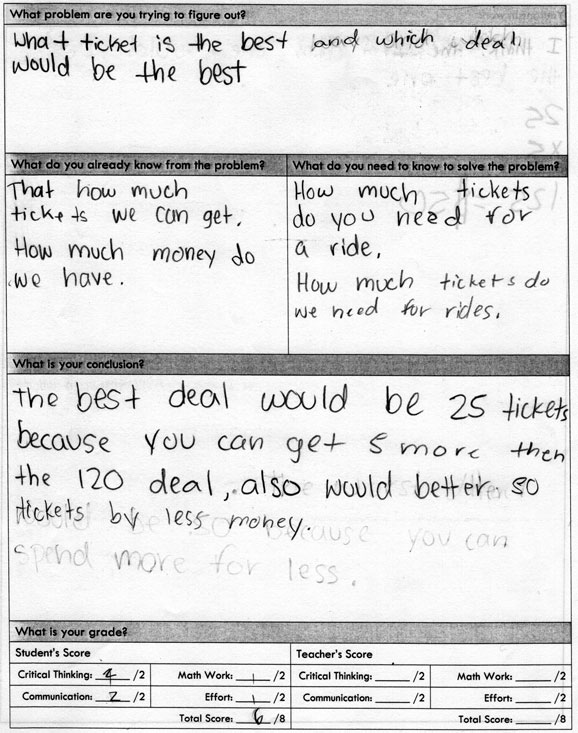
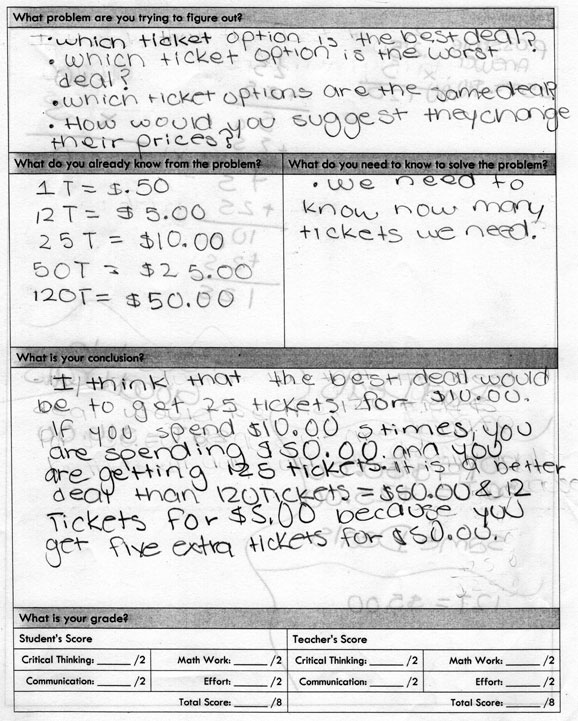
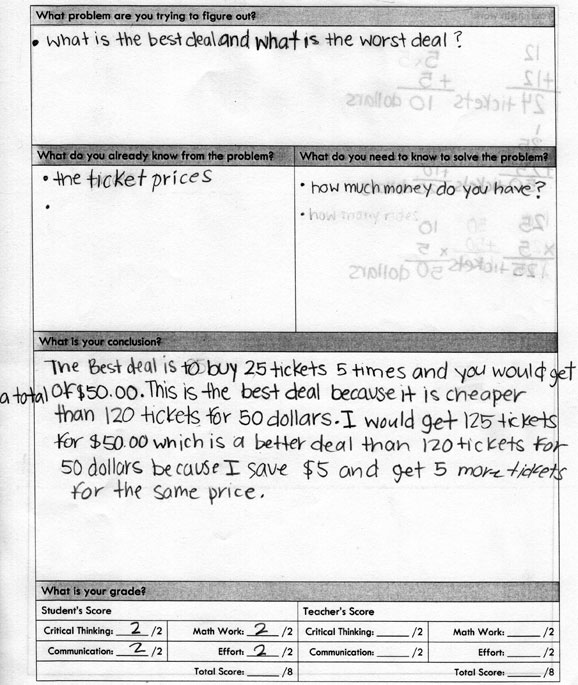
Virtually all students stated that the 25 tickets for $10 was the “best” deal.  However in terms of providing “sufficient reasoning to support [their] conclusion” (which will be required by the CCSS assessments) there was a range of success.  I have categorized students’ reasoning as demonstrated in the “What is your conclusion?” section as high, medium, and low.  Clearly there is room for the highs to improve, but they do a much better job of articulating their mathematical understanding using precise language than the lows and mediums:


Low 1


Low 2


Medium 1


Medium 2


High 1


High 2


What are your thoughts?  If you had a second day with these students, how would you guide them towards implementing a unit rate strategy?  Do you disagree with any of my low, medium, high rankings?


What Does It Mean To Understand Mathematics?

$
0
0

Several years ago I had a profound moment that led me to completely rethink what it meant to understand mathematics.  I was still in the classroom and had been working with 6th graders on adding and subtracting mixed numbers.  My formative assessments and observations showed that most students were proficient, and I felt pleased.

To end the unit I gave students an application of subtracting fractions using the context of a freeway sign with fractional distances.  Specifically I gave students the picture below (which is the first picture in this lesson) and asked them “How far apart are the exits for Junction 90 and Jefferson Blvd?”

I clearly expected students to do well with this problem, but as I walked around checking students’ progress I realized that something strange was going on.  I saw answers like:

  • 1/3
  • 1 1/3
  • 3 3/4

Relatively few students got 1/4.  When I asked a student why she got 1 1/3, she said, “It is 1 1/3 because 1 1/3 is between 1 1/2 and 1 1/4.”  I felt like it must have been April Fool’s day with the joke on me.  I didn’t know what had happened.  Was I wrong thinking that students were proficient… or worse… could this minor little context have thrown students off so significantly?

I needed to know for sure, so the next day I came to class and asked students what I considered to be the same problem with no context at all.  I just wrote 1 1/2 – 1 1/4 on the board and asked them for the answer.  Again, the results shocked me.  The vast majority of my students got the correct answer of 1/4.  I didn’t know how to reconcile the results of the two problems and this is when I started asking myself “What does it mean to understand mathematics?”

In the days that followed I reflected upon what happened and I decided that my students primarily had procedural skill and fluency but very limited conceptual understanding or the ability to apply mathematics.  I realized that for my students to “understand mathematics” they would have to have a more balanced understanding that included all three.  This experience provided the foundation for why I value using real-world applications whenever possible.  They provide a context for building the conceptual understanding and procedural skill needed for rigorous mathematical understandings.

Now out of the classroom, I work alongside teachers and my goal is to help them realize why the Common Core State Standards state that “educators will need to pursue, with equal intensity, three aspects of rigor in the major work of each grade: conceptual understanding, procedural skill and fluency, and applications.

To accomplish this I recently recorded myself working one-on-one with sixth graders completing the same problem that had been so meaningful to my professional growth.  I wasn’t sure if I could duplicate the results I had experienced years earlier but my plan was to begin each interview by asking the student about the freeway sign and then, regardless of how he or she answered, ask him or her to do 1 1/2 – 1 1/4.

Watch the first video below and note that I sped up time when he was working to make the video shorter.


Is this student demonstrating a rigorous mathematical understanding?  Does he have:

  • Procedural skill and fluency
  • Conceptual understanding
  • The ability to apply mathematics


To me it appeared that he had none of these mathematical understandings.  Now watch the follow up question with the same student.  Again I sped up time when he was working to make the video shorter.


Like I experienced in my classroom, to my surprise he got it right and it appears that this student does have procedural skill but could not navigate around a minor context to actually apply what he knows.  He has limited conceptual understanding to fall back on.   Clearly this one student is not representative of all students; however it has been my experience that students with superficial mathematical understandings exist in most classes.

Here is another student’s experience with the two problems.  Note that I did not speed up the video so you could see the time he spent thinking.


How do you reconcile what you just saw?  On the one hand you have a student who found the freeway problem so challenging that he sat for over thirty seconds thinking about how to solve the problem before giving up and stating, “Dang.  This is hard.”  Then he proceeded to solve the same problem procedurally and explained his process in a reasonably thorough manner.  If you had only seen him solve the fraction problem, would you think he could solve the freeway problem?  Does he have the rigorous mathematical understanding required by the Common Core State Standards?

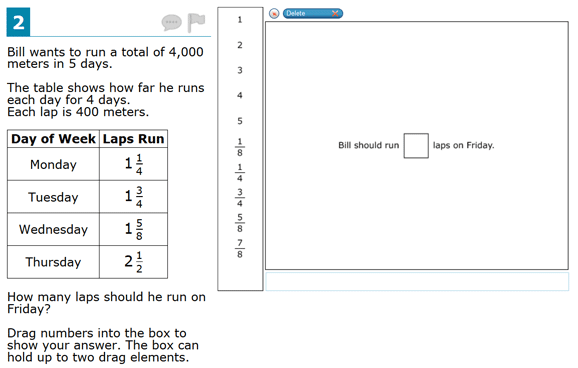
Something also worth considering is how subtracting mixed numbers has been and will be assessed.  The problem below is from the California Standards Test released test questions.  Would these two students get this problem correct?  Will this question determine whether they have a rigorous mathematical understanding?


This problem is from the new Smarter Balanced Practice Test for Grade 5 (Question #2).  Would these two students get this problem correct?  Will this question determine whether they have a rigorous mathematical understanding?


It is critical that we give students opportunities to develop rigorous mathematical understandings.  Procedural skill is still an essential piece but it is just as important as developing their conceptual understanding and the ability to apply mathematics.  Often times we teach students how to do mathematics with the belief that they will be able to apply it when the moment comes.  Clearly that is not always the case.

Problem-Based Learning Frequently Asked Questions

$
0
0
When teachers begin to implement problem-based learning, several questions consistently come up and I have a slide to discuss them during my presentations. At the 2014 California Math Council (CMC) North conference in Asilomar, Michael Fenton mentioned that these questions would be worth sharing in a blog post.


So, here are my frequently asked questions…


How long does it take to do a problem-based lesson?

Most problem-based lessons of the type that Dan, Andrew, Graham, and I do take about one to two 50-minute periods. Clearly many of them can take as long as you want, depending on whether you want to explore all the questions students come up with. Very few will take less than the whole period; and if they do then you are probably using a lesson that is too easy for the students doing them.  Similarly there are very few that require more than two days to complete. Remember, this is problem-based and not project-based. Project-based lessons can take weeks, months, or even the entire year but these usually take a day or two.


How often do you do problem-based learning?

The Common Core State Standards (CCSS) call for educators to pursue with “equal intensity” the three aspects of the Rigor shift: procedural skill and fluency, conceptual understanding, and application. Regardless of your support for the CCSS, it seems reasonable that students should have strength in all three components. So with that in mind, consider the following scenarios.

– If you do two or more problem-based lessons per week you would be spending at least 2-4 days per week on these lessons. That would take you away from the balanced rigorous understanding we are striving for. Their procedural skill and fluency as well as conceptual understanding would suffer.

– On the other end of the spectrum, problem-based lessons are most certainly not something you do once a semester or “after standardized testing.” You definitely won’t have balance that way either.

– I believe that the sweet spot lies in doing about one to two of these lessons per unit. They are a great way to introduce a context that will provide a foundation you can use to build conceptual understanding and later procedural skill and fluency. By starting a unit with a lesson, you begin with this context you can keep referring back to (i.e., “When we did the In-N-Out burger lesson, do you remember how we kept adding $0.90?”). Having a second lesson at the end of the unit provides a nice bookend to the unit and acts as a culminating review activity. Using problem-based lessons in this manner leads well into my next frequently asked question.


Do you use a problem-based lesson to begin a unit or after you’ve already taught them everything they need to know?

First off, let me say that I believe that using a problem-based lesson at any time is better than not using it at all. That being said, I strongly believe that problem-based lessons are most effective when you start a unit with one. To make this clearer, let me give you a rough sketch of a sixth grade unit on surface area.

Let’s assume you teach five periods and have three lower classes and two higher classes.  I would begin any unit on surface area with my favorite problem-based lesson: Andrew’s file cabinet task.

<tangent>If you’ve done this task, you know how amazing it is. If you haven’t, please do it with your students. I don’t care if they are kindergarteners or college students. It is such an amazing lesson because even if you don’t know a single thing about surface area, you can do this task. It is easily scaffolded so if you are a young kid, you can count the squares on the front side . If you are an adult, you will definitely not find the problem beneath you. It also provides such abundant context for developing the idea of area as non-overlapping square units and of surface area being comprised of the net formed by the area of each of the object’s sides.</tangent>

So, you start the unit with this problem.  Not surprisingly, the two higher classes are able to finish the file cabinet problem in one period on the first day. Also, not surprisingly, the three lower classes get stuck and even if you gave them a couple more days, you are not sure they would finish it. They do understand some of the foundational ideas such as having to cover the sides with stickies and that you would add all the sides together.  Most likely they get stuck on the computations and converting between square inches and stickies as units.  What they also have, very importantly, is the realization that there is something they want to figure out but don’t know how to figure it out. Those are two realities that are frequently missing when students learn mathematics.

Accordingly, after day one you have two classes who completed the task and three who haven’t. All classes now have the file cabinet as a context.  Now continue on with however you would normally help students develop conceptual understanding and procedural skill and fluency.  No one will be saying, “When will I ever use this?” because all new learning can be actively tied back to the context you’ve already created.

When talking about nets’ connection to surface area, students will be able to connect back to the file cabinet and more solidly grasp how the knowledge is interconnected. Eventually you will be done teaching the portion of the unit on conceptual understanding and procedural skill and fluency.  To wrap up the unit, it is important to recall where the classes were at.

The two high classes have already finished the file cabinet lesson, so clearly you can’t do that again. Fortunately there are many other lessons on surface area including my aluminum foil office prank lesson. For the two high classes, have them give this a try and it will be another opportunity for them to demonstrate that they can apply their knowledge. As for the low classes, it is time for them to return to the file cabinet task.

Remember that this was something that they wanted to figure out (if you don’t believe me, look at all the positive feedback about it on Twitter) but weren’t able to. Now comes the litmus test. If they can figure it out now, it is a wonderful moment because this was a skill they needed and wanted yet didn’t have. They can now realize the growth they have made. If they cannot figure it out, then it is an honest reality check that the lessons on procedural skill and fluency were not enough and intervention needs to happen. The final result is that all students have a strong skill set that they can apply.


How is problem-based learning graded?

I have three answers to this question:

  • Don’t grade it.  Do you grade all your other classwork?
  • Grade it using a rubric.  I tried this and even integrated it into version 4 of my problem solving framework.  What I learned was that it was so cumbersome and difficult to use that I couldn’t even figure it out… and I made the rubric!!  Getting through five periods of students just seemed ridiculous.  Ultimately I decided this was crazy to do and haven’t used it again.
  • Use a scoring scheme similar to what the Smarter Balanced Assessment Consortium (SBAC) initially published for their constructed response problems.  Essentially you get one point for a correct answer and one point for sufficient reasoning to support that answer.  You can modify this to be out of ten and be five points for a correct answer and one to five points for sufficient reasoning.


How long does it take to create a problem-based lesson?

The short answer is don’t make problem-based lessons. Unless you are one of the crazies like me or upcoming superstars such as Graham, Dane, or Kyle you should be spending your time preparing for these lessons by implementing the five practices rather than making the lessons. There are so many resources available online or via textbook publishers that it is just a waste of time for the majority of people.

SPOILER ALERT: In addition, the honest reality is that many of your first lessons will be awful. If you don’t believe me, check out my first lessons on the very bottom of this page. They are well intentioned but really not that good.  In related news, if you are using one of my first lessons, I apologize.

If after all my discouraging, you still really do want to create these lessons, then I would say that the lessons average around 5 to 10 hours to make.  I have done a few in a couple of hours and some have taken me over 40 hours by the time I had finished filming, editing, uploading, writing up the lesson, and posting them all over social media. Seriously, did you notice how many times Andrew changed clothes during the video of him covering the of the file cabinet? I think it was at least 5 times. That is a lot of time. I am so glad that was him and not me… and that he, and many others, are gracious enough to share them for free.


Please leave me any questions I missed in the comments.

4 Ways To Assess 3-Act Tasks

$
0
0

One of the most common concerns about implementing 3-Act Tasks (also known as problem-based lessons, application problems, or math modeling problems) is “How do you assess them?” Here are the four ways I use most often:

Option #1: Don’t Assess Them

You don’t grade every single classwork assignment, do you? So, similarly you shouldn’t feel compelled to have to grade these types of problems either. While it may seem obvious, some teachers avoid using these problem because they feel like it will be too time consuming to assess them later. If that’s what’s stopping you, then just skip the grading part because not using them at all is even worse.

Option #2: General Purpose Rubric

This is the most commonly used option and is relatively easy to implement if you need to get through a pile of 180 papers like secondary math teachers often do. The rubric originally came from the Smarter Balanced Assessment Consortium (SBAC) and consists of one point for a correct answer and one point for sufficient reasoning to justify the answer. Since I use this Problem Solving Framework when I do problem-based lessons, I just grade the “conclusion” section where students must write down their answer and explain how they got it.

One realistic concern with this rubric is that sometimes it’s hard to choose between assigning one point or zero points for a student’s explanation. So, this rubric can be easily modified to go from 0 to 5 points for correct answer and 0 to 5 points for sufficient reasoning to justify the answer. In that case, a student who gets the correct answer but whose reasoning is just OK might get a 5 for a correct answer but 2 points for his reasoning. Another issue with this method is that different teachers might give the same student different scores. This is a big concern if the problem is being used for a common assessment and leads to a need for Option #3.

Option #3: Problem-Specific Rubric

This rubric is time consuming to create and use but is essential when consistent scoring is required. The process begins by determining what aspects of the problem solving process are worth assessing. This may include criteria such as:

  • Getting the correct answer
  • Using the correct units
  • Explains the formula used
  • Writing as a narrative with complete sentences
Option #4: Practice-Specific Rubric

This rubric is something of a hybrid between a general purpose rubric and a problem-specific rubric in that it applies to virtually all problems but it also gives you more specific information.  It is called a practice rubric because you are evaluating students’ use of the Common Core State Standards’ Practice Standards.  So, some of the criteria might be:

  • Monitored and evaluated progress and changed course if necessary. (MP 1)
  • Checked their answers to problem using a different method. (MP 1)
  • Explained correspondences between equations, verbal descriptions, tables, and graphs. (MP 1)
  • Justified conclusions, communicated them to others, and responded to the arguments of others. (MP 3)
  • Stated the meaning of the symbols chosen. (MP 6)
  • Carefully specified units of measure. (MP 6)
  • Calculated accurately, efficiently, and expressed numerical answers with a degree of precision appropriate for the problem context.  (MP 6)

If you liked those criteria and want to see a much longer list you can pick from, then check this out.

Implementation Examples

To make this more concrete, I will implement the three rubric options on three students’ responses to my sinkhole problem.

Using the General Purpose Rubric

You can immediately see the problems with assigning 1 or 0 points with this first student.  This student stated 342,119 feet when it should be cubic feet.  I could make a case for 0, 0.5, or 1 point for correct answer.  Let’s say 1 point though.  Next comes the reasoning point.  I would have wanted to read more about the process the student used.  For example you don’t plug the width (diameter) of the hole into the formula.  You plug half the width (radius) so I would give them a 0 for sufficient reasoning.  So, if it was me I would give the student 1 point total.

This student is easier to grade.  The answer has the correct value and units, so 1 point for that.  The reasoning is sufficient as well so another 1 point for that giving a total of 2 points.

Like the second student this student earns 1 point for a correct answer.  I’d also give the student 1 point for sufficient reasoning for a total of 2 points.

Using the Problem-Specific Rubric

Let’s assume that we want to assess the four criteria listed below.  Next I have to assign point values to each criteria.  Obviously determining these point values will depend on the people making the rubric.  For this example I will use:

  • Getting the correct answer – 3 points
  • Using the correct units – 1 point
  • Explains that the radius is half of the diameter – 2 points
  • Writing as a narrative with complete sentences – 2 points

Let’s revisit the first student now using this rubric:

  • Getting the correct answer – 2 points
  • Using the correct units – 0 point
  • Explains that the radius is half of the diameter – 0 points
  • Writing as a narrative with complete sentences – 2 points

He didn’t quite get the right answer because of the units so I took a point off of “Getting the correct answer” and another point off of “Using the correct units”.  He didn’t explain anything about the radius so he lost two points there as well.  4 points total.

Next is the second student:

  • Getting the correct answer – 3 points
  • Using the correct units – 1 point
  • Explains that the radius is half of the diameter – 2 points
  • Writing as a narrative with complete sentences – 2 points

This student included every aspect I was looking for and earns all 8 points.

Finally we have the third student:

  • Getting the correct answer – 3 points
  • Using the correct units – 1 point
  • Explains that the radius is half of the diameter – 2 points
  • Writing as a narrative with complete sentences – 1 points

This was a tough one.  I took off one point for writing the conclusion as a narrative but I could see assigning full points too.  Obviously calibration would be critical to determine exactly what it would take to earn each point level.

Using the Practice-Specific Rubric

Let’s assume that we want to assess the four criteria listed below.  You might pick these if they were the things you valued and wanted students to do more of.  Next I have to assign point values to each criteria.  Obviously determining these point values will depend on the people making the rubric.  For this example I will use:

  • Student explains how equations, words, pictures, and/or symbols are connected. – 2 points
  • Student does not just state steps taken, but convinces reader that the steps they took are a correct way to approach problem. – 2 points
  • Student carefully specifies units of measureand uses it consistently in conclusion. – 1 points
  • Student accurately calculates a numerical value for the answer. – 3 points

Let’s revisit the first student now using this rubric:

  • Student explains how equations, words, pictures, and/or symbols are connected. – 0 points
  • Student does not just state steps taken, but convinces reader that the steps they took are a correct way to approach problem. – 0 points
  • Student carefully specifies units of measureand uses it consistently in conclusion. – 0 points
  • Student accurately calculates a numerical value for the answer. – 3 points


This student did not do a good job connecting the context with the math content so he get 0 points for explaining how they are connected.  He somewhat justified his conclusions and lost a point for not using the correct units.  He did calculate accurately so he got full points for that.  4 points total.

Next is the second student:

  • Student explains how equations, words, pictures, and/or symbols are connected. – 1 points
  • Student does not just state steps taken, but convinces reader that the steps they took are a correct way to approach problem. – 2 points
  • Student carefully specifies units of measureand uses it consistently in conclusion. – 1 points
  • Student accurately calculates a numerical value for the answer. – 3 points


This student did a good but not perfect job of explaining how his equation connected to the context so I took off a point for that.  I wouldn’t argue too hard against full points here though.  She justified her conclusion well for another 2 points.  She used the correct units (cubic feet) and explained why.  Finally she calculated accurately.  7 points total.

Finally we have the third student:

  • Student explains how equations, words, pictures, and/or symbols are connected. – 0 points
  • Student does not just state steps taken, but convinces reader that the steps they took are a correct way to approach problem. – 1 points
  • Student carefully specifies units of measureand uses it consistently in conclusion. – 0 points
  • Student accurately calculates a numerical value for the answer. – 3 points


This student’s conclusion is light on a narrative that explains how anything is connected.  There isn’t much of a convincing argument either.  So, 0 points and point for the first two criteria.  No units are specified, so 0 points there.  Finally she calculated accurately.  4 points total.

Conclusion

A couple of final notes:

  • With any rubric being used as a common assessment, you’ll need to go through a calibration process. A team of teachers that plan to use the rubric should find exemplars that show what it would take to earn each of the scores for each category. Clearly this process will take time, but once every grader is on the same page, the scores are much more likely to be comparable and reliable.
  • Remember that you can always mix it up and have students check out the rubric and/or evaluate themselves.  For example, if you showed them the rubric after they solved the problem but before they explain their reasoning, that would send them in the right direction.  Alternatively, you could show it to them after they are completely done, and this would give them a chance to make adjustments.

I hope that at least one of these assessment methods resonated with you.  What do you agree with?  Where have I missed the mark?  Are there any other options for assessing 3-Act Tasks that I missed?  Please let me know in the comments.

The post 4 Ways To Assess 3-Act Tasks appeared first on Robert Kaplinsky.

Math Modeling Can Tell You Who’s Pregnant

$
0
0

[This is one of a series of posts that explore real world examples of mathematical modeling to help educators better understand its applications. The most important post to read is this one about spies and analysts, which is a context I refer to in each of the posts.] 

I believe that there is still a lot of uncertainty about what exactly math modeling is. So, I want to share a humorous (and perhaps scary) story about how Target knew a 17-year-old girl was pregnant before the girl’s father did.

I’d read the article if you have time, but the summary is that Target (like most retailers) uses data about what you purchase to make predictions about what you’ll purchase in the future:

One Target employee I spoke to provided a hypothetical example. Take a fictional Target shopper named Jenny Ward, who is 23, lives in Atlanta and in March bought cocoa-butter lotion, a purse large enough to double as a diaper bag, zinc and magnesium supplements and a bright blue rug. There’s, say, an 87 percent chance that she’s pregnant and that her delivery date is sometime in late August.

Based on this information, Target then can send coupons to this customer to encourage her to shop at their store. It then goes on to talk about how this actually happened to someone:

“My daughter got this in the mail!” he said. “She’s still in high school, and you’re sending her coupons for baby clothes and cribs? Are you trying to encourage her to get pregnant?”

The manager didn’t have any idea what the man was talking about. He looked at the mailer. Sure enough, it was addressed to the man’s daughter and contained advertisements for maternity clothing, nursery furniture and pictures of smiling infants. The manager apologized and then called a few days later to apologize again.

On the phone, though, the father was somewhat abashed. “I had a talk with my daughter,” he said. “It turns out there’s been some activities in my house I haven’t been completely aware of. She’s due in August. I owe you an apology.”

So, let’s take a step back and think about this from the mathematical modeling perspective. There are two really important points:

  • Retailers have access to rich data
  • Data by itself is useless if you don’t know what to do with it

I want you to reflect on these those two points because they’re not trivial. Think about how you would even go about figuring out what data you need. Do you need to know the gender of the shopper? The time of day the purchase was made? How much money was spent? Stop and take thirty seconds to think about this. Out of all the available information, what would you want to help you make this decision? This is where the spy component comes in. What I mean is that with mathematical modeling one very important but often underappreciated part is acquiring the data. What data do you need? How are you going to get it?

Once you have all the data, now what? There are probably people who buy big purses and rugs that are not pregnant. The same thing for mineral supplements. So, how do you figure out who is and who is not pregnant? This is what mathematical modeling is all about, and I find it fascinating. This is where the analyst component comes in. Now that you have all the data you asked for, what do you do with that information once you have it?

Here’s another example for you. Think about being a Target data scientist who has access to all that data. One day you are asked to come up with a formula to predict, say, who is likely to go on a trip to warm weather location so that Target can send them coupons for bathing suits and sunscreen. What information would you look at? How would you value it to avoid false positives? Is this even possible?!

It’s the messy combination of data acquisition and formula creation that makes it so challenging. That’s mathematical modeling. If you were given the formula, then that wouldn’t be mathematical modeling at all.

While that may seem obvious, realize that this is often what happens in textbook. Instead of truly doing mathematical modeling, problem writers will focus solely on a context being real world and will sometimes even provide the formula.

So, now that you know what to look for, let’s give students as many opportunities as possible to do mathematical modeling. Here are over 70 free problems you can get started with.

Please let me know in the comments if you have any fun stories to explain what mathematical modeling is.

The post Math Modeling Can Tell You Who’s Pregnant appeared first on Robert Kaplinsky.

What If We Didn’t Teach What A Calculator Can Do?

$
0
0

Sometimes we do something just because that’s the way it’s always been done. This happens in sports just like in education. For example, consider the high jump. You’re probably familiar with the basic idea of seeing how high someone can jump over a bar.


What you may not know though is that athletes have not always participated in the high jump in the same way. It used to be that people would jump over the bar like a hurdle by using a scissor kick method. People always did it this way and people continued to do it this way. At least it was that way until 1968 Mexico City Olympics.


There, American Dick Fosbury introduced the world to a new technique by going over backwards. He utilized what would eventually be called the “Fosbury flop.”


Now it’s important to understand how strange this first appeared. His method was laughed by the fans. They would even chant, “Ole!” as he ran towards his jump.

His fellow athletes and coaches looked down on him like he disrespected the sport. The judges were even unsure if he was breaking the rules because they had not seen it done this way before. Ultimately, they agreed that it was ok and Fosbury used the technique to win the gold medal and set a new Olympic record. Today, virtually everyone uses this technique.

I share this story as an example of something called status quo bias. This happens when we do something in a particular way, not because it’s the best way but because that’s the way it’s always been done.

Dick Fosbury challenged the status quo with his new technique. It made people uncomfortable because it violated their expectations. However, once they got past that, they realized that his method was truly better and necessitated change.

I believe the same thing is happening in education, and specifically in regards to the mathematics standards we teach. Are our mathematics standards chosen because they are still the most important ones for students to learn or because that’s what we’ve always taught in math class?

I think that we need to take a step back and realize that so much of what we teach students is instantly useless because of technology. I’ll say it again to be clear, we spend days and weeks teaching students content that they’ll likely never use again because of the pervasive existence of technology like calculators.

Obviously, I’m not the first person to think of this. I love how Conrad Wolfram articulates it in his TED Talk. Just watch the first 30 seconds of the clip below (from 4:10 to 4:40).

Here’s what he said in those 30 seconds:

Now here’s the crazy thing right now. In math education, we’re spending about perhaps 80 percent of the time teaching people to do [computation] by hand. Yet, that’s the one step computers can do better than any human after years of practice. Instead, we ought to be using computers to do step three and using the students to spend much more effort on learning how to do steps one, two and four — conceptualizing problems, applying them, getting the teacher to run them through how to do that.

 
The first time I heard that part of the clip, it blew my mind. I had never thought of it that way.

So here are my thoughts:

  • When I surveyed 383 K-12 mathematics teachers in the United States, 85% of them stated that they did not have enough time to teach one year of grade level standards in one year.
  • Many of the math standards we teach students are computation based and can be done with technology.
  • Many of the non-computation based math standards are ones that computers (currently) cannot do such as complex mathematical modeling. For example, computers alone still can’t tell if you’re pregnant, but people with computers can.
  • As of 2015, 92% of American adults own cell phones they have with them constantly and most of those phones have calculators.

Based on this information, I reach the conclusion that we are spending too much time teaching procedures that will likely be replaced by technology. For example, how often are you multiplying multi-digit numbers, dividing decimals, or figuring out sales tax by hand?

I wonder what would happen if we greatly deemphasized teaching these procedures or cut them out entirely. What could we do with that time we freed up? Like with Dick Fosbury challenging the status quo with his new technique, I’m sure the idea of changing how these standards are prioritized will certainly make people uncomfortable because it violates their expectations.

What do you think? Please let me know in the comments.

The post What If We Didn’t Teach What A Calculator Can Do? appeared first on Robert Kaplinsky.


Mathematical Modeling: Do You Need Better Spies Or Analysts?

$
0
0

For years I’ve been trying to find a way to talk about mathematical modeling that made sense to me. I’ve finally found something I’m happy with and it has to do with the differences between spies and analysts. I’m sure this sounds strange, so let me explain.

The United States’ Central Intelligence Agency (CIA) is responsible for acquiring and using information to help American causes. There are two main groups in this agency: the people who acquire information (we’ll call them spies) and the people who break down and connect the information (we’ll call them analysts). Both are important because having more intelligence about what others are doing allows the United States to make more informed decisions. Let’s consider how this played out in both World War 2 and September 11th.
 

World War 2 and September 11th
In World War 2, we had many spies whose information was pivotal to the missions’ successes. It would follow that if we had more spies then, perhaps there would have been even more information leading to more successes.

Now let’s consider September 11th. What if we had more spies gathering information about what was going to happen? Would that have helped? It may seem like it would have, but unfortunately it wouldn’t have been as valuable as having more analysts.

Prior to the attack on 9/11/2001, the US intelligence community had received many tips about suspicious activity. For example, they knew about suspected terrorists who had been receiving flight instruction. So, in this case, the issue wasn’t that the information wasn’t available. The issue was that there weren’t enough analysts to take the information they received and determine what was useful and what was unimportant.

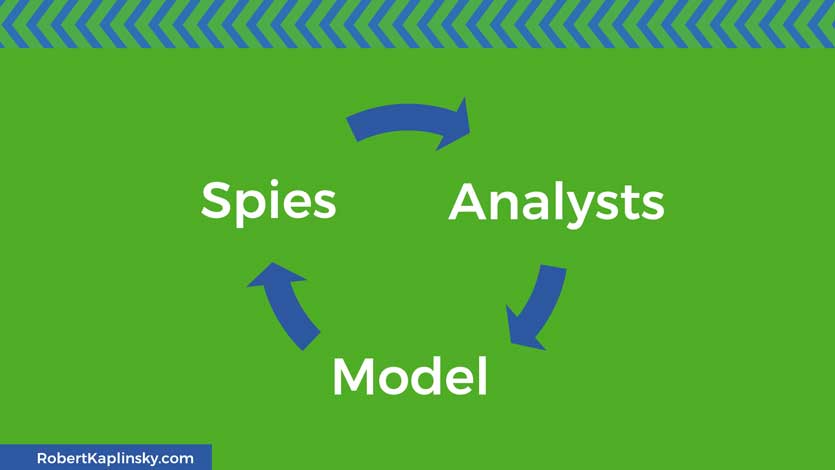
So, the way I see it, there are two primary components in this process:

  1. Spies figure out what information is needed and acquire it
  2. Analysts take the given information and work with it

Hopefully what results is actionable information that gives the US intelligence community what they want. If it doesn’t, then they need to modify their plans and look at where the process broke down. Was it an issue of the spies not getting the necessary information? Was it instead that the information was there but the analysts didn’t put it together?

The takeaway here is that we need a combination of both spies and analysts to find success. Interestingly, I believe that this structure of spies and analysts is very useful for gaining deeper understanding of mathematical modeling. To explain what I mean, let’s consider how we predict weather and earthquakes.
 

Weather and Earthquakes
Weather happens all the time and we’ve got great technology to measure it. We have plenty of data to work with and plenty of opportunities to verify if our forecasts are correct. So, why are our weather forecasts often incorrect? The problem here isn’t with the spies but with the analysts. We have not figured out how to use the data to get highly accurate forecasts. We need better analysts to take the available information and create a formula, or mathematical model, that more accurately predicts what will happen.

Now let’s think about how we predict earthquakes. Right now, we’re pretty awful at figuring out when future earthquakes will take place. We know that they will happen, but we can’t tell if they will take place in a week, a month, a year, a decade, or a century. So, how can we improve? Should we be investing in better spies or analysts? In this case, the problem is with our spies, not our analysts. Earthquakes happen so rarely that it’s hard to capture data on them. We have seismographs to measure earthquakes, but is that the best we can do? What about how animals seem to go crazy before an earthquake. Could there be other available data that our spies are not aware of or are not currently able to capture? Even if you come up with a highly accurate formula for predicting earthquakes, they happen so rarely that it makes it really challenging to fine tune it.

So, with mathematical modeling:

  1. Spies figure out what information is needed and acquire it
  2. Analysts take the given information and work with it


Structure Visualization
Here are visual representations of the steps. Realize that the spies and analysts are often the same single person or group of people in the context of solving a math problem.
 
First comes the spies who figure out what information is needed and acquire it.

 
Next comes the analysts who take the given information and work with it to figure out what to keep and how to use what remains.

 
Now you have a mathematical model created by the analysts using the information acquired by the spies. At this point, you can use the model and verify if it works. For example, does it actually predict the weather or earthquakes?

 
If it needs modifications (and almost all real mathematical models do) then it’s time to start the process over again. The spies will verify that they have the right information and the analysts will consider other ways of using the provided information.


Conclusion
I’m extremely curious about how this structure can help us make better sense of mathematical modeling and how it might prevent us from getting so far from what what we’re after. Accordingly, I’m starting a series of posts called “Math Modeling Can…” that will explore what this looks like in the context of actual math modeling problems. You can read the first one right now about how Target figured out a 17-year-old girl was pregnant and sent her diaper coupons before her father even knew she was going to have a baby! I hope you’ll be curious about this too and let me know where you think I’m on the right track and what concerns you have in the comments below.

The post Mathematical Modeling: Do You Need Better Spies Or Analysts? appeared first on Robert Kaplinsky.

Math Modeling Can Get You Kicked Off A Plane

$
0
0

[This is one of a series of posts that explore real world examples of mathematical modeling to help educators better understand its applications. The most important post to read is this one about spies and analysts, which is a context I refer to in each of the posts.]
 
Do you remember reading about the man who was literally dragged off a United Airlines flight in April 2017? One of the questions people had was “Why was he the one they picked?” People speculated that it might have been because of his race or spoken language.

The reality was that, for both better and worse, that had nothing to do with why he was picked. He was picked because United Airlines used mathematical modeling to determine that he was their least profitable customer.
 

How It Works
Very often people miss their plane flights, so airlines tend to sell more tickets than there are seats on the plane. Usually, no one notices this way in which airlines try to maximize their profits because there almost always are enough empty seats from people who miss their flight. When there aren’t enough seats, then problems happen.

In this case, when United Airlines could not persuade someone to give up their seat, they had to decide which passenger would be forced to leave. Put another way, if you had 201 people for a 200-person flight, how would you choose the one person who would not fly?

Stop and take thirty seconds to think about this. Out of all the available information, what would you want to help you make this decision? This is where the spy component comes in. What I mean is that with mathematical modeling one very important but often underappreciated part is acquiring the data. What data do you need? How are you going to get it? When you’ve got an idea of what data you would use, read on.
 

Realize that United had to go through this same process and in their Contract of Carriage Document it states that “If there are not enough volunteers, other Passengers may be denied boarding involuntarily in accordance with UA’s boarding priority” and then “the priority of all other confirmed passengers may be determined based on a passenger’s fare class, itinerary, status of frequent flyer program membership, and the time in which the passenger presents him/herself for check-in without advanced seat assignment.”

So, out of all the data they could choose from, they picked these as the most important:

  • Fare class (coach vs. business vs. first class)
  • Itinerary (are there any connecting flights and will this missed flight create a chain reaction of missed flights?)
  • Status of frequent flyer program membership (loyal frequent flyers generate more money)
  • Check-in time (presumably those who checked in earlier should get priority)

Now with the data chosen, this is where the analysts come in. What are they going to do with all this information? How are they going to manipulate it to create a mathematical model (which could also be called a formula or algorithm) to weigh the variables and decide which customer is the least profitable for them? In other words, if being kicked off a plane made the customer so mad that they never purchased a flight from them again, who would cost United the least amount of money?

I’m definitely not stating that I like their mathematical model, that the practice of overselling flights is sound, or that they handled asking him to leave in a professional manner. I’m just trying to show you an example of how mathematical modeling is used. I want to open up some of the complexities so that we realize that if our job was creating the formula, it wouldn’t be easy.

If this was a stereotypical textbook problem, it might begin by giving the already created formula and a set of data. Then it might ask you to determine which person would not fly. That would not be mathematical modeling though. Creating the actual mathematical model, not using it, is the hardest part.

The post Math Modeling Can Get You Kicked Off A Plane appeared first on Robert Kaplinsky.

Math Modeling Can Pick The Best Colleges

$
0
0

[This is one of a series of posts that explore real world examples of mathematical modeling to help educators better understand its applications. The most important post to read is this one about spies and analysts, which is a context I refer to in each of the posts.]
 
You’ve probably heard of US News and World Report’s Best Colleges issue where they rank American institutions of higher education in numerical order and sell the rankings to anyone interested. Have you ever thought about how they actually determine the rankings?

If you were tasked with doing the same, how would you even begin the process? What information would you consider? Once you had that information, what would you do with it? How would you weigh the factors you looked at? This may not seem like a big deal, but it is to US News and World Report which makes millions of dollars each year from its rankings.

The process they use is called mathematical modeling. Their goal is to use mathematics to help take a complex set of information and present it in a usable format. This process is not easy and certainly not without its many criticisms. So, my goal is to open up the complexities so that we can better appreciate how mathematical modeling is used. Think of what follows as your attempt to do a better job than what US News and World Report does.

The first part of the process requires the spies. So, I want you to stop and take thirty seconds to think about what information you would use to create a better set of rankings. If my request doesn’t feel daunting to you, it should. What would you consider? SAT scores? Total number of students? Size of campus? Location? Majors offered? The list could go on and on. Once you’ve determined what information you’d want, keep reading.
 

US News and World Report Data
Now it’s time for a comparison. The list below contains every factor that US News and World Report used for their 2018 rankings. Do you have any matches? Are there any you hadn’t listed but agree/disagree with? To not spoil anything, I have intentionally scrambled the order that the factors are listed and will also share the link to where I got this data from later on in the post.
  • Financial resources
  • Student selectivity
    • SAT and ACT test scores
    • Percentage of students who graduated near the top of their high school class
    • Acceptance rate or the ratio of students admitted to applicants
  • Graduation rate performance
  • Alumni giving rate
  • Graduation and retention rates
  • Faculty resources
    • Class size
    • Faculty salary
    • Proportion of professors with the highest degree in their fields
    • Student-faculty ratio
    • Proportion of faculty who are full time
  • Undergraduate academic reputation

 
Now with that information at hand, what do you even do with it all? Should each component be equally important? If not, how would you weigh each one? This is where the analysts come in. Their job is to take the data and break it down in such a way that it becomes useful. Take 30 more seconds to weigh the factors listed above and then read on to see how US News and World Report weighs them.


US News and World Report Weighting
Now it’s time to compare how you weighted the data to how US News and World Report weighted the data they used for their 2018 rankings. Realize that if you have a different weighting, it does not necessarily mean that you are wrong. It means that you have different priorities. Also, US News and World Report continues to adjust their weightings in an effort to get a better formula over time.
  • Graduation and retention rates (22.5%)
  • Undergraduate academic reputation (22.5%)
  • Faculty resources (20%)
    • Class size (40% of faculty resources)
    • Faculty salary (35% of faculty resources)
    • Proportion of professors with the highest degree in their fields (15% of faculty resources)
    • Student-faculty ratio (5% of faculty resources)
    • Proportion of faculty who are full time (5% of faculty resources)
  • Student selectivity (12.5%)
    • SAT and ACT test scores (65% of student selectivity)
    • Percentage of students who graduated near the top of their high school class (25% of student selectivity)
    • Acceptance rate or the ratio of students admitted to applicants (10% of student selectivity)
  • Financial resources (10%)
  • Graduation rate performance (7.5%)
  • Alumni giving rate (5%)

 
What do you think about their weightings? What do you agree with? What did they get wrong? You have to realize that if you got 1000 people in a room and had them make a list of the data and corresponding weights, there would be no duplicates.
 

Conclusion
This is not an easy process. Again, I’m not trying to say that US News and World Reports (detailed explanations) has gotten this right. I’m also not trying to say that there aren’t problems inherent with ranking anything (side note: don’t even get me started with ranking pies because pumpkin pie is the worst). My only intention is to get you into the mindset of what real mathematical modeling feels like. It’s messy. It’s not perfect. It requires a lot of assumptions.

I believe that this is the future of mathematics for our students. We can’t say that we’re creating college and career ready students when we spend years of their K-12 experience teaching them to do things that calculators can already do and are never to be used again. We need to find a way to spend more time teaching them how to do mathematical modeling, which will be a very useful skill.

The post Math Modeling Can Pick The Best Colleges appeared first on Robert Kaplinsky.

Math Modeling Can Tell Amazon Which Products To Recommend

$
0
0

[This is one of a series of posts that explore real world examples of mathematical modeling to help educators better understand its applications. The most important post to read is this one about spies and analysts, which is a context I refer to in each of the posts.]
 
What if I told you that you could make billions of dollars by using mathematical modeling? Well, that’s exactly what Amazon has been using when they recommend products for you to buy. These product recommendations frequently come in the form of “People who bought __________ often buy __________, __________, or __________” and result in additional purchases that generate significant revenue.

So, what if you worked for Amazon and they tasked you with creating a formula to make these recommendations? Where would you begin? What information would you want to know? What would you do with that data once you had access to it? These are the topics I’m exploring in my spies and analysts post. I want to walk you through the process so that you can better appreciate the complexities of mathematical modeling.

The first part of the process requires the spies. So, I want you to stop and take thirty seconds to think about what information you would use to make your product recommendations. What would you consider? Where the customer lives? The time of day? Upcoming holidays? The customer’s gender? The list could go on and on. Once you’ve determined what information you’d want, keep reading.
 

Potential Amazon Data
While Amazon does not publish the actual data they use, a data mining and analytics industry expert has suggested it may include:
  • Previously purchased items may suggest interests
  • Items added to carts but not purchased
  • Pricing experiments online where they offer the same products at different prices and see the results
  • Experiments where they offer products in different “bundles”
  • Your wishlists
  • Other sites you’ve visited may provide information about your interests
  • How long you look at an item before moving on
  • Product ratings you or people in your social network have left
  • Demographic information such as your shipping address to know what people in your general area like
  • Clicking on a link in an email
  • Items you viewed on their site
  • Number of times you viewed an item before final purchase
  • Purchase history from other partner stores

 
If you’re not feeling overwhelmed by the sheer magnitude of that level of data, you should be. It’s a blessing and a curse because while the information is very helpful Amazon likely has more information in those categories than we can possibly imagine. Now what do you even do with it all? Should each piece of information be equally important? If not, how would you combine and weigh each one? This is where the analysts come in. Their job is to take the data and break it down in such a way that it becomes useful. Take 30 more seconds to think about which of those factors you would prioritize.


Conclusion
I’m hoping that at this point, you have a better appreciation for the complexities of mathematical modeling. Once the spies and analysts are done acquiring the information and putting it together, they still have to determine whether the formula (or mathematical model) they come up with is any good. Can you imagine the never-ending refinement that a model like this must require?

At this point, there are no computers or calculators that can figure this out on their own. This is where the jobs are at. If we truly want to focus our time and energy in a skill that will really help our students become college and career ready, mathematical modeling is where we need to be.

The post Math Modeling Can Tell Amazon Which Products To Recommend appeared first on Robert Kaplinsky.

Why Do We Have Word Problems?

$
0
0

I want to begin this blog post with a question: why do we have word problems?

I don’t mean why do we need or use word problems but rather why do they even exist in the first place? This may seem unimportant or trivial, but I think that understanding the answer to that question will be useful in understanding their role in math education today.

Take a look at the image below. It is from the book Milne’s Inductive Algebra which is an Algebra textbook published in 1881 by Eclectic Press. When I first received this book as a gift about ten years ago, I was very curious as to what would be inside. How had Algebra in the United States changed over the last 125 years?

What I came to realize was that not much has changed. There were definitely many word problems, but I realized that when this book was published there probably weren’t great options for incorporating context into problem solving.

Let’s compare that to present day instruction. Today we have many alternatives for providing authentic and engaging contexts (such as my problem-based lessons). So, why do we still use so many word problems?

Is it because word problems exist in real life? Not that I can see.

Is it because using word problems are the best way to instruct students? Almost certainly no.

Or, is it because of status quo bias where we continue to use them because that’s the way we’ve always taught math? This is what I think is happening.

This is not a trivial point to me. While word problems can be useful, losing focus of what’s important (making sense of mathematics) leads to teaching students strategies like the ones below.

There are three very important takeaways here:

  • Teaching strategies like CUBES is not teaching mathematics. It’s teaching how to decode a kind of problem writing style that has no application in real life. At best, it teaches students how to be a math robot like I was. I could give you the correct answer but I had no idea what I was actually doing. It’s very similar to the Chinese Room thought experiment and leads to creating students like the last student in this short and terrifying video.
  • The main reason educators teach strategies like CUBES is because they may help students solve the kinds of problems they will likely see on standardized assessments. No one is teaching these because this is something that is used in real life.
  • Finally, word problems are virtually non-existent in real life. There are certainly plenty of real life contexts, but very few of them are set up as neatly written word problems. In real life you have to create your own problem by figuring out what information is important and using it to solve the problem.

I think it’s important for us as educators to take a step back and think about what tools we use and why we use them. To be clear, I’m not saying that teachers should never use word problems, but it depends on both why they’re used and how they’re used.

For example, word problems are commonly used in Cognitively Guided Instruction (CGI). In those situations, it’s never about mindlessly using a technique to find the answer but rather about providing a context where conversations about sense making can come out. You’re never going to see a CGI-trained educator teaching CUBES.


Conclusion
My goal for this blog post was to create a little controversy and make us rethink our choices. If you want to explore this further, I suggest you check out my free webinar which was originally live, but is now recorded for you to watch anytime. I have versions for elementary, middle, and high school.

So, what do you agree with and why? Or, where am I missing the point and need to think more deeply? Please let me know in the comments.

The post Why Do We Have Word Problems? appeared first on Robert Kaplinsky.

Math Modeling Can Tell Pandora Which Music You Might Like

$
0
0

[This is one of a series of posts that explore real world examples of mathematical modeling to help educators better understand its applications. To learn about Spies and Analysts, I recommend watching this webinar (with elementary, middle, and high school versions) or reading this blog post.]
 
If you’ve ever used Pandora, then you know that it has an amazing ability to recommend music to you that you may have never heard but really enjoy. They play a song for you, and you can give it a thumbs up if you really like it, thumbs down if you really don’t like it, or neither if it’s just ok. After a little while, it seems to somehow know your taste in music better than you know it! This leads you to stay on their site longer, and as a result, they can play more ads or get you to pay for them to go away.

So, what if you worked for Pandora and they asked you to create a formula to predict which songs people have never heard but will probably like? Where would you begin? What information would you want to know? What would you do with that data once you had access to it? These are the topics I’m exploring in my spies and analysts post. I want to walk you through the process so that you can better appreciate the complexities of mathematical modeling.

The first part of the process requires the spies. So, I want you to stop and take thirty seconds to think about what information you would use to recommend songs. Would you look at which songs are being played the most on radio stations or selling the most records? Maybe where a person lives affects the kind of music they listen to? Does gender or age matter? The list of questions could go on and on. So, think about what information you’d pick if this was your job. Once you’ve determined what information you’d want, keep reading.
 

Spies
As it turns out, Pandora does not look at any of the information I listed below. Instead, Pandora created something called the Music Genome Project which is an effort to categorize songs by their attributes. According to Wikipedia:

A given song is represented by a vector containing values for approximately 450 “genes” (analogous to trait-determining genes for organisms in the field of genetics). Each gene corresponds to a characteristic of the music, for example, gender of lead vocalist, prevalent use of groove, level of distortion on the electric guitar, type of background vocals, etc. Rock and pop songs have 150 genes, rap songs have 350, and jazz songs have approximately 400. Other genres of music, such as world and classical music, have 300–450 genes.

 
Apparently it takes 20 to 30 minutes to categorize each song. Can you imagine the amount of work it would take to do this for every single song in existence!? Crazy enough, this is just part of how Pandora works. Specifically, even if you had all that information about the songs, how do you write a formula to figure out which song to play? Is “gender of lead vocalist” more important than “prevalent use of groove”? Remember, if your formula isn’t good, customers won’t stick around and you’ll be out of business.

This is where the analysts come in. Their job is to take the data, figure out what parts are more or less important, and break it down in such a way that it becomes useful. Take 30 more seconds to think about how you might even begin to work with the data.


Analysts
I hope you’re feeling a bit overwhelmed at this point. If figuring this kind of stuff was easy, then everyone would have a company worth over $2 billion, like Pandora is. Here’s what Pandora does, according to Wikipedia:

The system depends on a sufficient number of genes to render useful results. Each gene is assigned a number between 0 and 5, in half-integer increments.The Music Genome Project’s database is built using a methodology that includes the use of precisely defined terminology, a consistent frame of reference, redundant analysis, and ongoing quality control to ensure that data integrity remains reliably high.

For the record, I don’t completely understand what that just said either! The reality is that they created a formula to take all of that information, determine what was most important, and make it into a product that earns them significant revenue.


Conclusion
I’m hoping that at this point, you have a better appreciation for the complexities of mathematical modeling. Once the spies and analysts are done acquiring the information and putting it together, they still have to determine whether the formula (or mathematical model) they come up with is any good. For example, if people are clicking thumbs down too often, it’s a sign that your mathematical model is not doing its job. Can you imagine the never-ending refinement that a model like this must require?

At this point, there are no computers or calculators that can figure this out on their own. This is where the jobs are at. If we truly want to focus our time and energy in a skill that will really help our students become college and career ready, mathematical modeling is where we need to be.

The post Math Modeling Can Tell Pandora Which Music You Might Like appeared first on Robert Kaplinsky.

Math Modeling Can Tell You How Much Your Home Is Worth

$
0
0

[This is one of a series of posts that explore real world examples of mathematical modeling to help educators better understand its applications. To learn about Spies and Analysts, I recommend watching this webinar (with elementary, middle, and high school versions) or reading this blog post.]
 
Perhaps you’ve heard of Zillow, which is a real estate website that can give you a rough estimate for how much a real estate property is worth. While the property values they share are not as researched or accurate as what you would get from a professional appraisal, the fact that they instantly provide this data for free for over 100 million homes is pretty amazing.

So, what if you worked for Zillow and they asked you to create a formula to more accurately predict how much a home is worth? Where would you begin? What information would you want to know? What would you do with that data once you had access to it? These are the topics I’m exploring in my spies and analysts post. I want to walk you through the process so that you can better appreciate the complexities of mathematical modeling.

The first part of the process requires the spies. So, I want you to stop and take thirty seconds to think about what information you would use to accurately predict a home’s value. Would you look at what the home previously sold for? Would you look at how close it is to freeways and schools? Would you look at the crime rate? Would you look to see what other nearby homes have sold for? The list of questions could go on and on. So, think about what information you’d pick if this was your job. Once you’ve determined what information you’d want, keep reading.
 

Spies
Zillow lists the following data as being a part of the formula they use. While it doesn’t include all the data I had mentioned, none of what they do list is very surprising:

Physical attributes: Location, lot size, square footage, number of bedrooms and bathrooms and many other details.

Tax assessments: Property tax information, actual property taxes paid, exceptions to tax assessments and other information provided in the tax assessors’ records.

Prior and current transactions: Actual sale prices over time of the home itself and comparable recent sales of nearby homes


So now that we know some of the data they use, how would we go about turning that into a price for the home? Is “lot size” more important than “number of bedrooms and bathrooms”? Remember, if your formula isn’t good, customers won’t spend their time on your site and you’ll be out of business.

This is where the analysts come in. Their job is to take the data, figure out what parts are more or less important, and break it down in such a way that it becomes useful. Take 30 more seconds to think about how you might even begin to work with the data.


Analysts
I hope you’re feeling a bit overwhelmed at this point. If figuring this kind of stuff was easy, then everyone would have a company worth over $5 billion, like Zillow is. Here’s what Zillow does, according to their website:

We use proprietary automated valuation models that apply advanced algorithms to analyze our data to identify relationships within a specific geographic area, between this home-related data and actual sales prices. Home characteristics, such as square footage, location or the number of bathrooms, are given different weights according to their influence on home sale prices in each specific geography over a specific period of time, resulting in a set of valuation rules, or models that are applied to generate each home’s Zestimate.

Just when you thought it was hard enough to figure out what information you needed, you start to realize that even doing something with that information is challening too! The reality is that they created a formula to take all of that information, determine what was most important, and make it into a website that earns them significant revenue.


Conclusion
I’m hoping that at this point, you have a better appreciation for the complexities of mathematical modeling. Once the spies and analysts are done acquiring the information and putting it together, they still have to determine whether the formula (or mathematical model) they come up with is any good. For example, when they compare actual sales data to the predictions they made and see a big gap, it’s a sign that your mathematical model is not doing its job. Can you imagine the never-ending refinement that a model like this must require?

At this point, there are no computers or calculators that can figure this out on their own. This is where the jobs are at. If we truly want to focus our time and energy in a skill that will really help our students become college and career ready, mathematical modeling is where we need to be.

The post Math Modeling Can Tell You How Much Your Home Is Worth appeared first on Robert Kaplinsky.


Math Modeling Can Tell Dating Websites Who You Might Like

$
0
0

[This is one of a series of posts that explore real world examples of mathematical modeling to help educators better understand its applications. To learn about Spies and Analysts, I recommend watching this webinar (with elementary, middle, and high school versions) or reading this blog post.]
 
You’ve probably heard of dating websites (like eHarmony, OkCupid, or Match.com) that help you find someone you might be interested in. You enter your information, take a survey, and then hope you’re connected with the right people. That’s what the websites hope too, because they make their money through people signing up for memberships. The reality for these websites is that people have to see others they are interested. If they do, they will stick around, refer their friends, and the company will make money. If not, their customers will leave and they will go out of business.

So, what if you worked for eHarmony and they asked you to create a formula to decide which people to pair up? Where would you begin? What information would you want to know? What would you do with that data once you had access to it? These are the topics I’m exploring in my spies and analysts post. I want to walk you through the process so that you can better appreciate the complexities of mathematical modeling.

The first part of the process requires the spies. So, I want you to stop and take thirty seconds to think about what information you would use to match potential customers. Would you look at where they lived? How old they were? How much education they have? The kinds of foods they like to eat? Whether they want to get married? The list of questions could go on and on. So, think about what information you’d pick if this was your job. Once you’ve determined what information you’d want, keep reading.
 

Spies
I hope you’re starting to get a sense of the enormous number of factors to consider. You have to balance the reality that you need to ask many questions to learn about your customers’ preferences, but you also don’t want to overwhelm them with a survey that takes hours to complete. Choosing the right questions is not easy, and that is part of why some dating website succeed while others fail.

As for eHarmony, they are so proud of what they ask you about that they advertise their “29 dimensions of compatibility” as a selling point for their website. Those dimensions are:
 

Character & Constitution:
  • Good Character
  • Dominance vs. Submissiveness
  • Curiosity
  • Industry
  • Vitality & Security
  • Intellect
  • Appearance
  • Sexual Passion
  • Artistic Passion
  • Adaptability


Emotional Makeup & Skills:
  • Emotional Health
  • Anger Management
  • Quality of Self Conception
  • Mood Management
  • Communication
  • Conflict Resolution
  • Kindness
  • Autonomy vs. Closeness


Personality:
  • Obstreperousness
  • Sense of Humor
  • Sociability
  • Energy
  • Ambition


Family & Values:
  • Feelings about Children
  • Family Background
  • Education
  • Spirituality
  • Traditionalism
  • Values Orientation

 
In reading this list, many definitely make sense. Some, like “Obstreperousness” I had never even heard of. So, let’s imagine that you made a survey that measured all of these factors. Now what? How do you turn them into a person to show? Is “Education” more important than “Ambition”? What about the reality that what people say they want often differs from the people the date? This is where the analysts come in. Their job is to take the data, figure out what parts are more or less important, and break it down in such a way that it becomes useful. Take 30 more seconds to think about how you might even begin to work with the data.


Analysts
Having so much information is both a blessing and a curse. What would you do with all that information? I think that most people would begin by looking at what is most important. However, what’s really interesting about this process is that the answer is both what information should be prioritized and what information should be ignored. Here’s what Dr. Steve Carter, the Chief Scientist at eHarmony said:

The Chief Scientist at eHarmony has revealed that although singles are asked to choose likes and dislikes on a sliding scale, unless they pick the extreme ends their answers will be largely ignored. Dr Steve Carter said it stopped daters ending up ‘in a universe of one.’

 
Think about that! Sometimes to make customers happy, they have to be saved from themselves by ignoring what they say!


Conclusion
I’m hoping that at this point, you have a better appreciation for the complexities of mathematical modeling. Once the spies and analysts are done acquiring the information and putting it together, they still have to determine whether the formula (or mathematical model) they come up with is any good. For example, if people aren’t finding many matches that turn into relationships, it could be a sign that your mathematical model is not doing its job. Can you imagine the never-ending refinement that a model like this must require?

At this point, there are no computers or calculators that can figure this out on their own. This is where the jobs are at. If we truly want to focus our time and energy in a skill that will really help our students become college and career ready, mathematical modeling is where we need to be.

The post Math Modeling Can Tell Dating Websites Who You Might Like appeared first on Robert Kaplinsky.

Math Modeling Can Tell Uber How Much To Charge You

$
0
0

[This is one of a series of posts that explore real world examples of mathematical modeling to help educators better understand its applications. To learn about Spies and Analysts, I recommend watching this webinar (with elementary, middle, and high school versions) or reading this blog post.]
 
We now live in a world where ride sharing services like Uber and Lyft are considered commonplace. You just open the app on your mobile device, request a vehicle to pick you up, get in, and you’re on your way. If you’ve used such a service a few times, you’ve also probably noticed that the same trip might cost significantly different prices, depending on when you use it. So, how does a ride sharing service like Uber know how much to charge you? This really matters because if they charge too much, you might use a competitor, a taxi, or public transportation. If they charge too little, they may not make enough money to stay in business.

So, what if you worked for Uber and they asked you to create a formula to competitively price their trips? Where would you begin? What information would you want to know? What would you do with that data once you had access to it? These are the topics I’m exploring in my spies and analysts post. I want to walk you through the process so that you can better appreciate the complexities of mathematical modeling.

The first part of the process requires the spies. So, I want you to stop and take thirty seconds to think about what information you would use to competitively price customers’ trips. Would you look at how far the driver has to go? Does traffic matter? Does the driver’s experience level matter? Should fancier cars cost more? Should it cost more if you have more passengers? Should it cost less when demand is low and more when demand is high? Does the city you’re in matter? As I hope you realize, the list of questions could go on and on. So, think about what information you’d pick if this was your job. Once you’ve determined what information you’d want, keep reading.
 

Spies
Uber considers a variety of factors when determining your fare including:
  • Time the trip takes
  • Distance the trip takes
  • Tolls and fees
  • Whether there are enough drivers in the area to meet demand
  • Whether you are sharing a ride with other passengers you don’t know
  • The vehicle’s luxury level

So, much of what I imagined them using was included, but the reality is that we are still far from a dollar amount to charge. How do you take all those factors and turn them into a formula that pumps out a competitive price?
This is where the analysts come in. Their job is to take the data, figure out what parts are more or less important, and break it down in such a way that it becomes useful. Take 30 more seconds to think about how you might even begin to work with the data.


Analysts
Turning this into a formula is not easy. If it is was, then everyone would be on their way to having a company valued at over $72 billion, like Uber is. So, here’s what Uber does to calculate their fares:

Your Uber fare is first calculated on 4 main criteria:

  • Base fare – A flat fee charged at the beginning of every ride
  • Cost per minute – How much you are charged for each minute you are inside the ride
  • Cost per mile – How much you are charged for each mile of the ride
  • Booking Fee – A flat fee to cover Uber’s operating costs

 
Here’s how Uber uses the 4 main criteria above to calculate your fare:

Base Fare + (Cost per minute * time in ride) + (Cost per mile * ride distance) + Booking Fee = Your Fare


From there it gets a little more complicated. First, comes the issue of driver supply and demand. If there are more people requesting rides than there are drivers to supply them, Uber uses something called “Surge Pricing” which will multiply the cost of your trip by a multiplier. For example, when a sporting event ends and everyone wants a ride at the same time, your fare might be multiplied by 2 or 3. While this might seem like price gouging, it is also a huge incentive for drivers from distant areas to come to your area and pick you up.

Then come many other factors that get added in like tolls and fees, how luxurious the vehicle you request is, whether you’re sharing a ride with strangers, and the city you’re traveling in.


Conclusion
I’m hoping that at this point, you have a better appreciation for the complexities of mathematical modeling. Once the spies and analysts are done acquiring the information and putting it together, they still have to determine whether the formula (or mathematical model) they come up with is any good. For example, if people open your app to check for the price but don’t actually take a ride, it could be sign that your mathematical model is not doing its job. Can you imagine the never-ending refinement that a model like this must require?

At this point, there are no computers or calculators that can figure this out on their own. This is where the jobs are at. If we truly want to focus our time and energy in a skill that will really help our students become college and career ready, mathematical modeling is where we need to be.

The post Math Modeling Can Tell Uber How Much To Charge You appeared first on Robert Kaplinsky.

Math Modeling Can Tell Us If We Get Free Tacos

$
0
0

[This is one of a series of posts that explore real world examples of mathematical modeling to help educators better understand its applications. To learn about Spies and Analysts, I recommend watching this webinar (with elementary, middle, and high school versions) or reading this blog post.]
 
In March 2001, Russia’s Mir space station was falling out of orbit and was going to crash into the Pacific Ocean. Taco Bell used this as an bizarre marketing opportunity and placed a 40′ x 40′ sign in the middle of the ocean with a target on it that said “Free Taco Here!”. If the Mir hit the sign on the way down, everyone in the United States would get free tacos.

Here’s a short video to refresh your memory:


So overall, this is a fairly wild proposition. But I want you to think about this from Taco Bell’s perspective. Sure, they would get great advertising for this stunt (and Mir did not ultimately hit the sign), but what if the space station hit the sign and Taco Bell had to pay up? Would that cost thousands of dollars? Millions? Billions? How would you even figure it out?

What Taco Bell ultimately decided to do was take out an insurance policy from SCA Promotions, a company that guarantees prizes. What this means is that SCA Promotions charged Taco Bell a fee, and if the Mir hit the target, Taco Bell would not have to pay anything more. In fact, Taco Bell was probably hoping and praying that it hit the target as it would have boosted sales and cost them nothing.

Consider though what SCA Promotions had to do to figure out how much to charge Taco Bell. If they charged too much, Taco Bell wouldn’t feel like it was worthwhile. If they charged too little, it wouldn’t be worth the risk to make the deal. If the Mir missed the target, they’d get all the money. If the Mir hit the target, their company could go bankrupt!

So, what if you worked for SCA Promotions and you were asked you to figure out how much to charge Taco Bell for this insurance policy. Where would you begin? What information would you want to know? What would you do with that data once you had access to it? These are the topics I’m exploring in my spies and analysts post. I want to walk you through the process so that you can better appreciate the complexities of mathematical modeling.

The first part of the process requires the spies. So, I want you to stop and take thirty seconds to think about what information you would use to figure out the cost of the insurance policy. Would you look at how how big the sign is? The speed of the Mir? The number of people in the United States? The cost of a taco? The number of people who like tacos? The time of day? As I hope you realize, the list of questions could go on and on. So, think about what information you’d pick if this was your job. Once you’ve determined what information you’d want, keep reading.
 

Spies
SCA promotions does not specify the exact information they used, but here’s what we have:
  • The sign was 40′ by 40′.
  • In 2001, there were an estimated 281 million people living in the United States and the cheapest Taco Bell taco cost 60 cents. Taco Bell estimated the cost of the free tacos at $10,000,000. Accordingly, that seems to assume that about 6% of the population would actually take advantage of a free taco.
  • According to the video, the area that the Mir was expected to crash into was approximately 3600 miles (5794 km) x 120 miles (193 km) by of the that the Mir

What’s important to realize is that the only solid fact is the size of the sign. The cost of the tacos and the size of the area where the Mir might crash are estimates. That being said, based on the video, it sounds many of the factors I thought of were included. So, how do you take all those factors and turn them into an amount of money to charge Taco Bell?

This is where the analysts come in. Their job is to take the data, figure out what parts are more or less important, and break it down in such a way that it becomes useful. Take 30 more seconds to think about how you might even begin to work with the data.


Analysts
First, let’s assume that the Mir has an equal likelihood to land in any part of the crash zone. In reality, I suspect that it may be more likely to land closer to the middle and less likely towards the sides of the rectangle.

If that’s the case, then the area of the sign is 1600 square feet while the area of the crash zone is 432,000 square miles. Converting square miles to square feet gives us an area of 12,043,468,800,000 square feet for the crash zone. This results in a ~0.0000000133% (or 1 in 7,500,000,000) chance of hitting the target. So now what? How much do you charge Taco Bell?

The way I see it, a ~0.0000000133% chance of having a $10,000,000 payout leads to an expected value of having to pay $0.001 on average. So, I guess that charging anything over a penny should earn you money over the long run. I don’t know what Taco Bell was actually charged, but with odds like this, I’m surprised that they didn’t just cover the costs themselves.


Conclusion
I’m hoping that at this point, you have a better appreciation for the complexities of mathematical modeling. Once the spies and analysts are done acquiring the information and putting it together, they still have to determine whether the formula (or mathematical model) they come up with is any good. So many assumptions were made here that are likely incorrect. For example, we don’t even know for sure whether the sign was placed inside of the crash zone! This may seem like no big deal, but SCA Promotions has to take it seriously or it could bankrupt the company.

At this point, there are no computers or calculators that can figure this out on their own. This is where the jobs are at. If we truly want to focus our time and energy in a skill that will really help our students become college and career ready, mathematical modeling is where we need to be.

The post Math Modeling Can Tell Us If We Get Free Tacos appeared first on Robert Kaplinsky.

Viewing all 18 articles
Browse latest View live


Latest Images