For years I’ve been trying to find a way to talk about mathematical modeling that made sense to me. I’ve finally found something I’m happy with and it has to do with the differences between spies and analysts. I’m sure this sounds strange, so let me explain.
The United States’ Central Intelligence Agency (CIA) is responsible for acquiring and using information to help American causes. There are two main groups in this agency: the people who acquire information (we’ll call them spies) and the people who break down and connect the information (we’ll call them analysts). Both are important because having more intelligence about what others are doing allows the United States to make more informed decisions. Let’s consider how this played out in both World War 2 and September 11th.
Now let’s consider September 11th. What if we had more spies gathering information about what was going to happen? Would that have helped? It may seem like it would have, but unfortunately it wouldn’t have been as valuable as having more analysts.
Prior to the attack on 9/11/2001, the US intelligence community had received many tips about suspicious activity. For example, they knew about suspected terrorists who had been receiving flight instruction. So, in this case, the issue wasn’t that the information wasn’t available. The issue was that there weren’t enough analysts to take the information they received and determine what was useful and what was unimportant.
So, the way I see it, there are two primary components in this process:
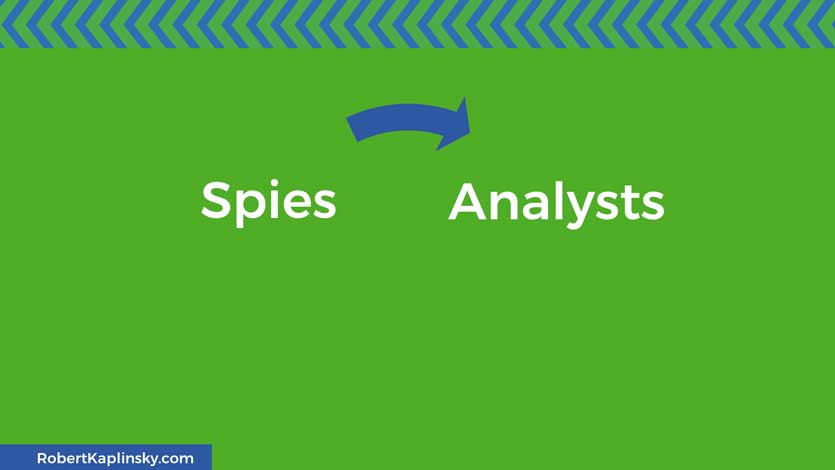
- Spies figure out what information is needed and acquire it
- Analysts take the given information and work with it
Hopefully what results is actionable information that gives the US intelligence community what they want. If it doesn’t, then they need to modify their plans and look at where the process broke down. Was it an issue of the spies not getting the necessary information? Was it instead that the information was there but the analysts didn’t put it together?
The takeaway here is that we need a combination of both spies and analysts to find success. Interestingly, I believe that this structure of spies and analysts is very useful for gaining deeper understanding of mathematical modeling. To explain what I mean, let’s consider how we predict weather and earthquakes.
Now let’s think about how we predict earthquakes. Right now, we’re pretty awful at figuring out when future earthquakes will take place. We know that they will happen, but we can’t tell if they will take place in a week, a month, a year, a decade, or a century. So, how can we improve? Should we be investing in better spies or analysts? In this case, the problem is with our spies, not our analysts. Earthquakes happen so rarely that it’s hard to capture data on them. We have seismographs to measure earthquakes, but is that the best we can do? What about how animals seem to go crazy before an earthquake. Could there be other available data that our spies are not aware of or are not currently able to capture? Even if you come up with a highly accurate formula for predicting earthquakes, they happen so rarely that it makes it really challenging to fine tune it.
So, with mathematical modeling:
- Spies figure out what information is needed and acquire it
- Analysts take the given information and work with it
First comes the spies who figure out what information is needed and acquire it.

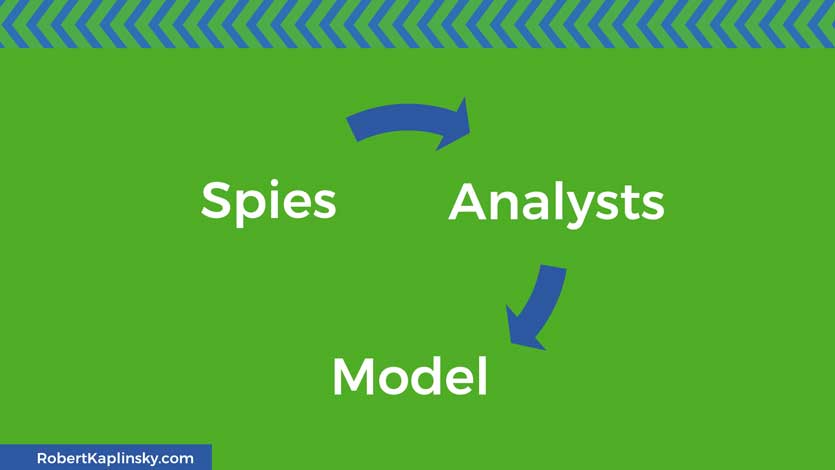
Next comes the analysts who take the given information and work with it to figure out what to keep and how to use what remains.
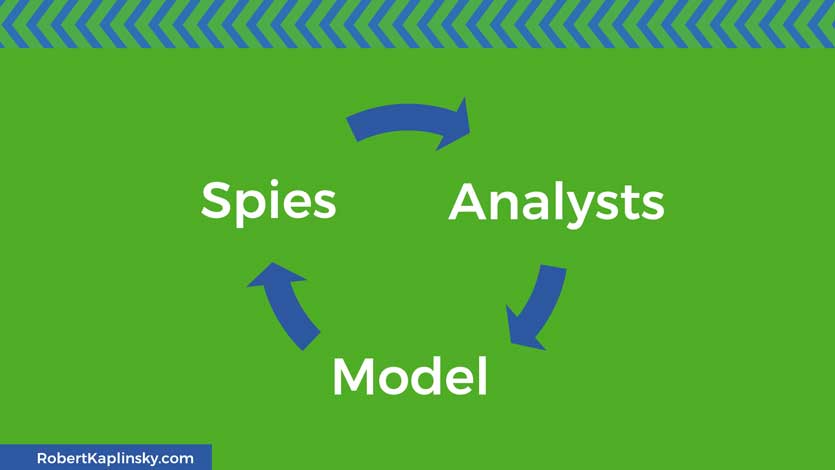
Now you have a mathematical model created by the analysts using the information acquired by the spies. At this point, you can use the model and verify if it works. For example, does it actually predict the weather or earthquakes?
If it needs modifications (and almost all real mathematical models do) then it’s time to start the process over again. The spies will verify that they have the right information and the analysts will consider other ways of using the provided information.
The post Mathematical Modeling: Do You Need Better Spies Or Analysts? appeared first on Robert Kaplinsky.


